
Quantifying Vitality With CFDA-AM Fluorescent Stain
Written by Robert Beezer
Quality & Regulatory Compliance Manager
Wyeast Laboratories, Inc.
Viability has long been used for assessing the suitability of a yeast culture in brewing but interest in measuring vitality has increased recently. While viability is a measurement of the living cells in a culture, vitality is a measurement of the metabolic state of the cells. Measuring the metabolic state of cells assures that a yeast culture is capable of catalyzing reactions associated with fermentation and surviving the harsh environments of wort and beer. Vetting a yeast culture based on vitality can therefore prevent common issues in brewing such as stalled fermentations, low attenuation, and yeast-derived off flavors.
There are different strategies for determining vitality. Generally, vitality assays measure intracellular enzymatic activity or the presence of cell components critical for survival.1 One commercially available assay for measuring vitality utilizes a fluorescent dye to stain cells with functional esterase enzymes, which we will discuss in depth here. This particular dye is hydrolyzed by intracellular esterase enzymes after passive diffusion into yeast cells.2 Presence of the fluorescent stain in the cell indicates that cells are not only alive but also capable of catalyzing metabolic reactions. The metabolic reactions occurring within cells are what transform wort into beer, and direct measurement of yeast metabolism through vitality analysis can be used to predict the fermentation performance of a yeast culture.
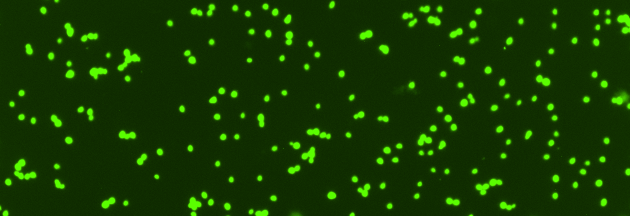
The intensity at which a cell fluoresces is directly related to the hydrolysis of the CFDA-AM stain and some samples will contain a mixture of cells with varying fluorescence intensity (Figure 1). A number of factors influence the fluorescence intensity including concentration of the stain used, temperature of the incubation, duration of the incubation, intracellular pH, and efflux of the fluorescent probes.2 The majority of these variables are controlled by the conditions of the assay and the main factor influencing fluorescent intensity is the intracellular esterase activity. Previous research performed with this assay by Chan et al. (2012) utilized the fluorescence intensity value of each cell in a sample to observe the percentage of high fluorescence cells.3 By calculating the percentage of high fluorescence cells, the vitality of a cell culture is quantified and can be compared across samples.
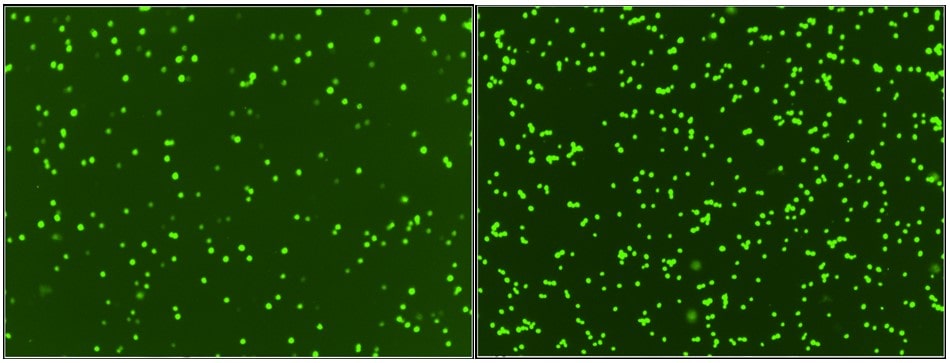
Figure 1. A cell culture showing varied fluorescence intensity (left) and a cell culture showing uniform fluorescence intensity (right).
To demonstrate the change in the percentage of high fluorescence cells, our research laboratory performed vitality analysis on seven lots of 1056 American Ale® stored for varying lengths of time at 35 °F (1.6 °C) (Figure 2). For the 1056 American Ale® sample stored for 6 days, visualizing the cell fluorescence intensity with a histogram reveals a defined peak between 60 and 160 intensity counts (Figure 2a). After longer periods of storage, the peak flattens and shifts towards lower intensity values due to a reduction in cell esterase activity, representing a decrease in vitality of the culture (Figure 2b-g). A strategy for quantifying this decrease is to use the intensity value where the peak began in the sample after 6 days of storage. The arrow of Figure 2a shows this value, 60 counts, which can be used as a critical value for calculating the percentage of high fluorescence cells in each sample of 1056 American Ale®. The equation for this calculation of vitality is below.
Vitality (%) = number of cells with fluorescence intensity above critical value / total number of cells
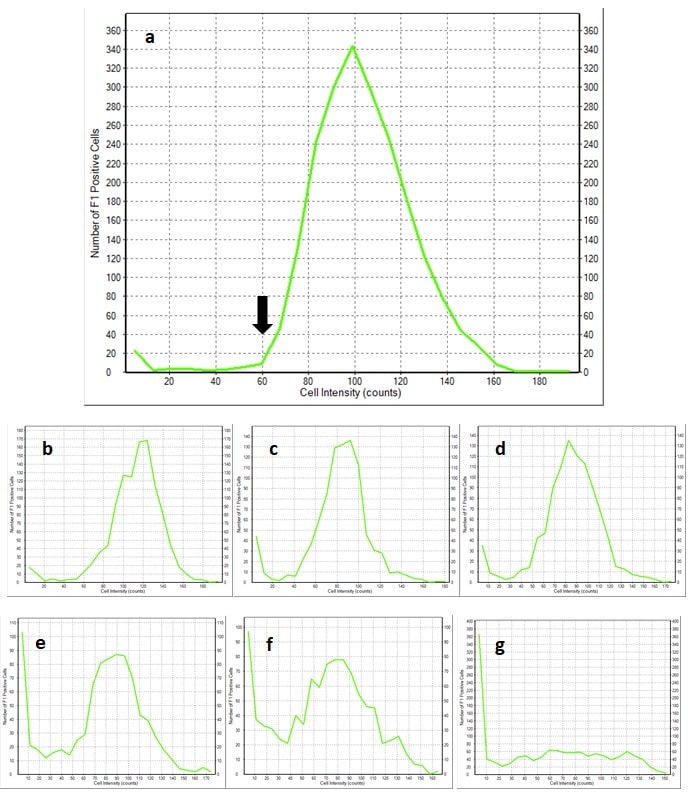
Figure 2. Histograms of cell fluorescence intensity measurements on 1056 American Ale® stored at 35 °F (1.6 °C) for 6 (a), 33 (b), 68 (c), 90 (d), 125 (e), 153 (f), 181 (g) days. Each histogram is the result of analyzing a unique lot of yeast with the CFDA-AM fluorescent stain. The arrow on the histogram for yeast stored for 6 days after propagation shows the critical value for high fluorescence cells.
Calculating the percentage of high fluorescence cells in each sample reveals a decline in vitality over time (Figure 3). While this result is expected, plotting the vitality along with the viability demonstrates the sensitivity and value of the vitality measurement. Over the 180 days of storage, vitality decreased from 97.7% to 48.6% while viability decreased from 99.9% to 66.0%. The difference in the two measurements over a shorter period of two months of storage shows almost a three times greater change in vitality, with a 12.3% drop in vitality compared to a 4.3% drop in viability. Live yeast cultures are typically stored for short periods of time. As a manufacturer this is often a matter of days to weeks, and similarly for breweries. Therefore, the vitality assay is a more sensitive and informative assay than viability for detecting changes in a yeast culture.
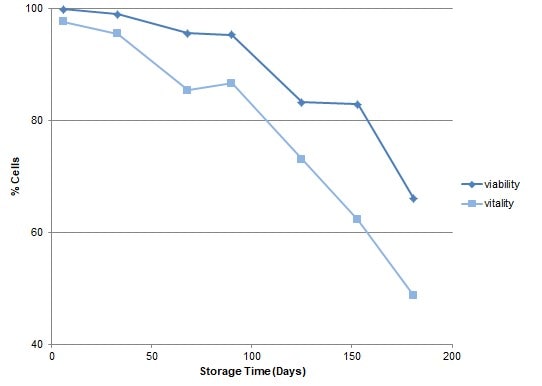
Figure 3. Changes in viability and vitality of yeast cultures during storage. Viability was measured using propidium iodide stain.
The method for quantifying vitality described here is a rapid procedure which provides a more complete understanding of a cell culture’s suitability for use in a fermentation. Measuring vitality allows our laboratory team to detect small differences between cultures while performing quality control screening and during research and development work. This information can then be applied to the propagation process for refining culture health, stability, and fermentation performance. With advancements like this in yeast and fermentation science, we can ensure our products will reliably undergo successful fermentations in your brewhouse, resulting in high quality beers.
- Magdalena, K. and Renata Z. 2014. Comparison of methods used for assessing the viability and vitality of yeast cells. FEMS Yeast Research 14: 1068-1079.
- Breeuwer, P.; Drocourt, J.; Bunschoten, N.; Zwietering, M.; Rombouts, F.; Abee, T. 1995. Characterization of Uptake and Hydrolysis of Fluorescein Diacetate and Carboxyfluorescein Diacetate by Intracellular Esterases in Saccharomyces cerevisiae, Which Result in Accumulation of Fluorescent Product. Applied and Environmental Microbiology 61(4): 1614-1619.
- Chan, L.; Kury, A.; Wilkinson, A.; Berkes, C.; Pirani, A. 2012. Novel image cytometric method for detection of physiological and metabolic changes in Saccharomyces cerevisiae. Journal of Industrial Microbiology and Biotechnology 39: 1615-1623.